
ATR | Average True Range | Why Pros Keep ATR in Their Toolkit
Ever get chopped to pieces on a breakout, only to watch price rip after you’re stopped out? Or worse — buy into the move just before it dies? ATR help you spot fake outs, and hold runners

A lot of traders spend countless hours drawing support and resistance levels, iFVG, order blocks, breaker blocks, liquidity sweeps, only to find themselves getting stopped out trade after trade — or worse, watching their trade stop them out and run to their profit target.
All of these strategies seem different, but they all have one thing in common, they perform best when market is in range expansion. Aka Average True Range expansion.
What starts out as a perfect A+ setup dies out instantly once volatility compresses, and then price chops sideways. When the ATR is flat there is no fuel behind the move, what looks like a breakout turns into a fake out, and traders are left confused and frustrated— why was there setup performing so well before only to leave them taking paper cut after paper cut now?
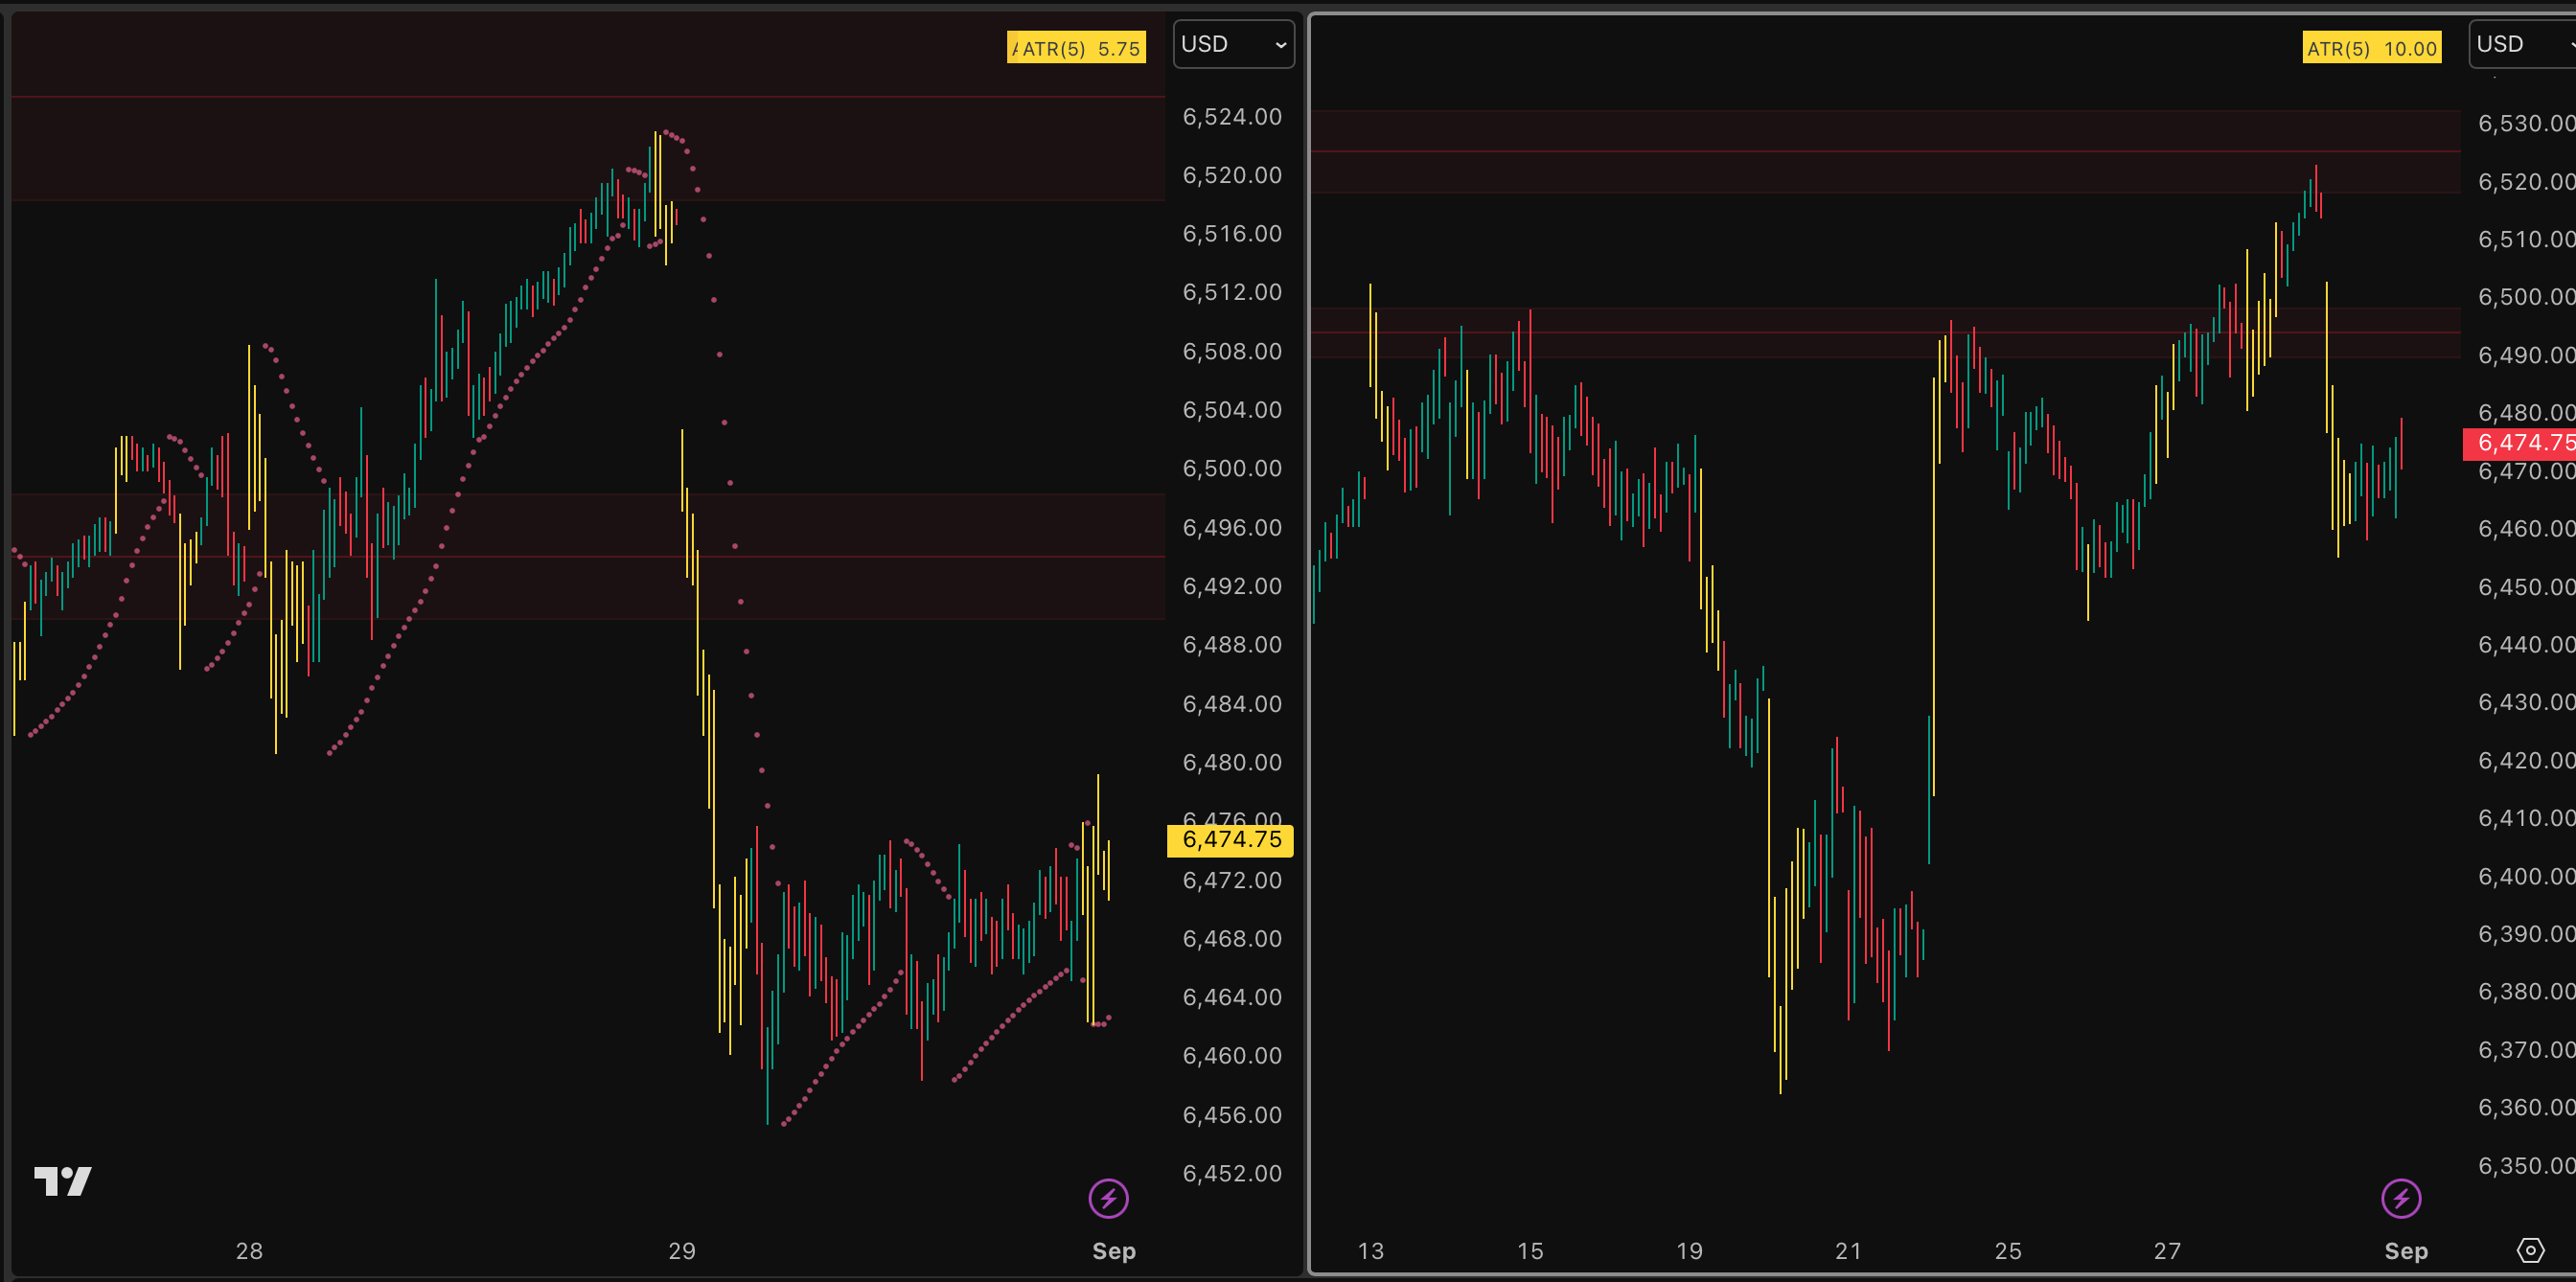
As a bonus for my premium subscribers who use tradingview — I have coded a pinescript to highlight bars where volatility is expanding, and display the ATR in the corner. Just go ahead and send me a message with you TV name and I will send the invite.

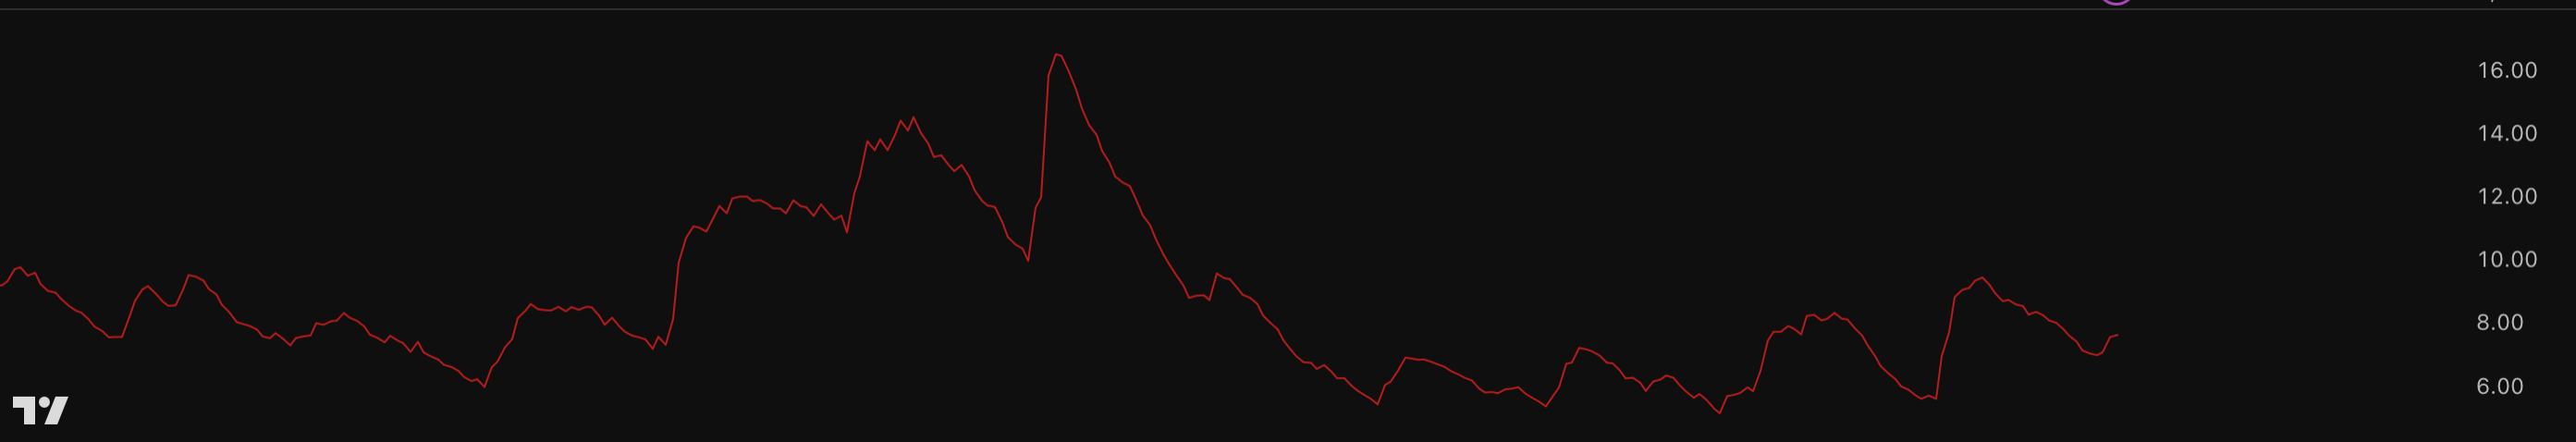
This is the standard ATR study — which I am not a fan of
I will also include links to my grid for 5m/15m chart w ATR study
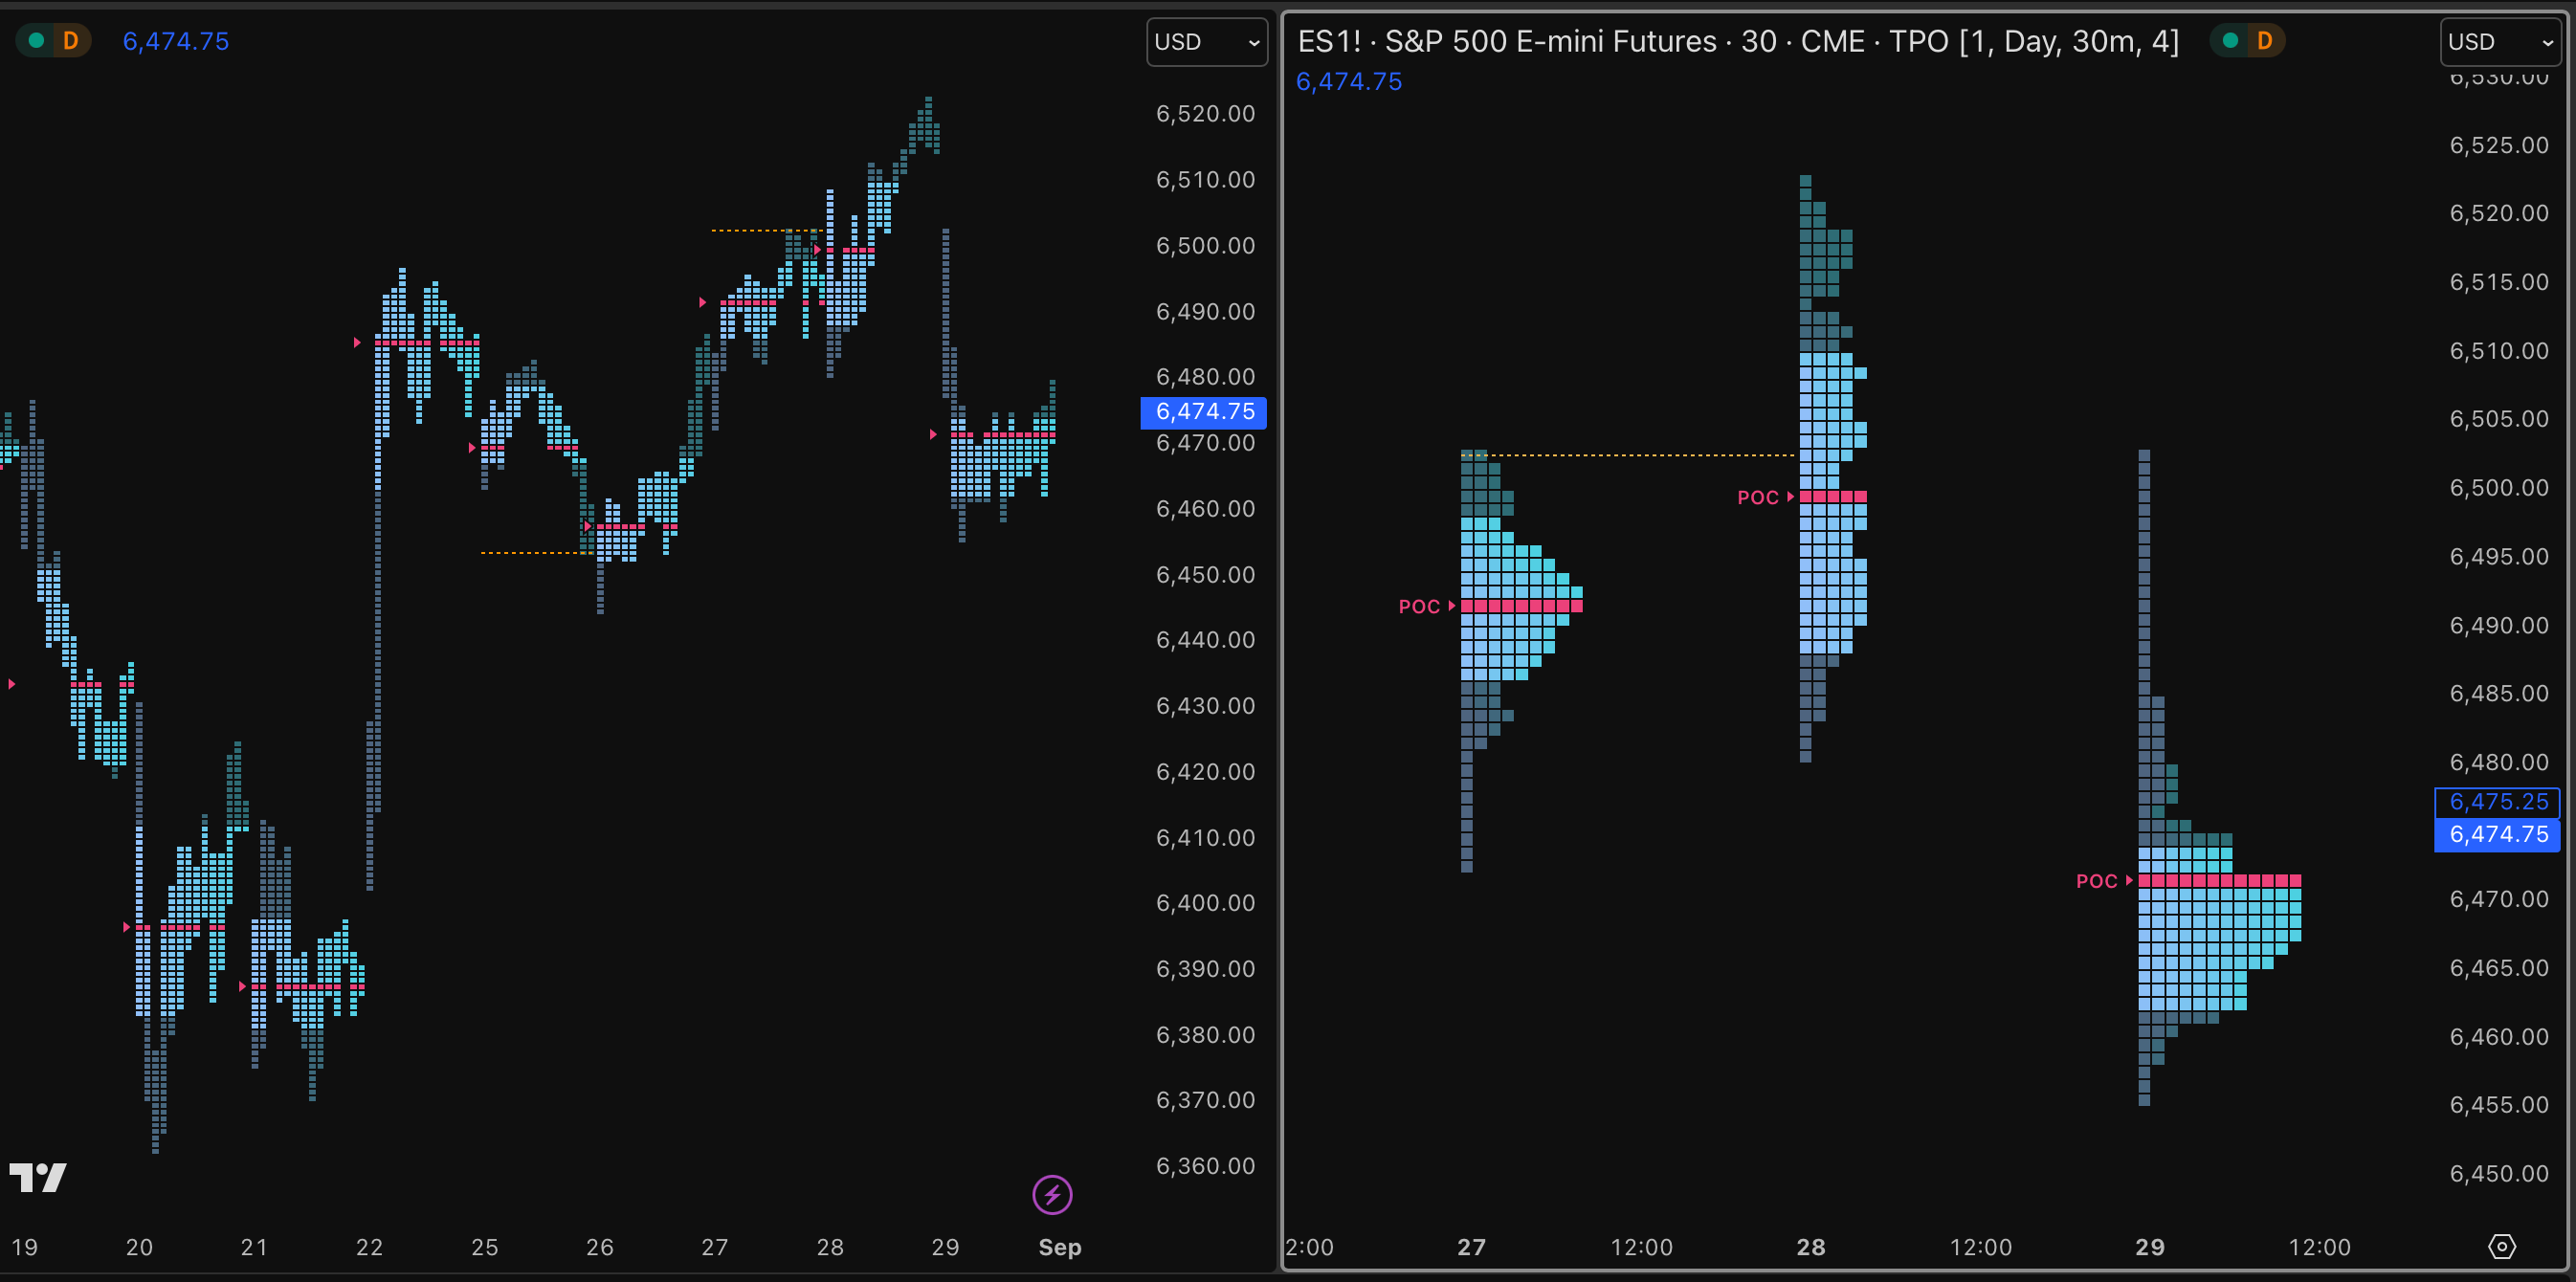
As well as my TPO chart template highlighting poor highs/lows in orange.
I believe there is a minimum tier required for you to see TPO on tradingview tho.
Contents of the article
What is ATR and why do most pros use it
How to use ATR
With Market Replay
Position sizing
Stop placement
Measuring reward
Combining ATR with levels
Combining ATR with execution
Using ATR for trade plan and management
Example using my trade plan for the week
What is ATR ? And why do most pros use it.
I was taught to view the market thru the lens of ATR, risk sizing, targets, strategy, everything ties back to ATR.
ATR or Average true range is a volatility metric, it tells you how much the market is moving, on average, in a certain amount of time. Unlike other indicators, this is a purely volatility metric, it measures the high-low of price over a set period of time.
A high ATR = price swinging wide ranges. AKA Range expansion.
A low ATR = range compression AKA Range compression.
While most retail trades are focused on where price is, pros are focused on how much room does price have to move. ATR adjusts in realtime. So as volatility expands, the ATR gets higher, showing higher chances of a follow through when price starts to breakout.
This metric can complement any strategy — ICT concepts, breakout trading, even supply/demand zones — because it answers the question most traders ignore: how much room does price actually have to move?
How to use ATR
ATR is not just an indicator — it is a frame work for structuring trades and risk management. Since it adjusts with the market dynamics, it helps you size according to the current market conditions.
